Climate of the Salish Sea Bioregion
Part of the Salish Sea Atlas.

The Salish Sea Bioregion's climate is temperate, with cool, rainy winters and warm, dry summers. Most of the bioregion is classified as a "temperate oceanic" or "warm-summer Mediterranean" climate according to the Köppen climate classification system. The moderating influence of the Pacific Ocean and the Salish Sea keeps temperature mild throughout the year. Precipitation varies strongly over the seasons, with most of the yearly precipitation arriving via winter storms steered onshore by the jet stream. Topography is highly variable across the region, which creates dramatic variations in local precipitation and temperature patterns.
This chapter of the Salish Sea Atlas explores the wind, precipitation, and temperature characteristics of the Bioregion using data averaged for the 1991-2020 period.
Wind
The Salish Sea Bioregion is located within the large-scale wind belt known as the Westerlies, within which winds are expected to blow most frequently from the southwest to the northeast on average over the year. At a local scale, topographic barriers and seasonal shifts in atmospheric pressure patterns lead to spatial and seasonal variability in the prevailing wind direction experienced at any given location.
This map shows the prevailing, or most frequent, direction of wind for specific climate stations in January (purple arrows) and July (brown arrows) based on 1991-2020 averages. You can zoom and pan to explore the map, and use the buttons below to view months individually.
In July, winds blow most often from the south or southwest across much of the region. In January, winds most frequently blow from the southwest in the Puget Sound region and from the west along the Strait of Juan De Fuca, bringing cool, humid air inland from the Pacific Ocean. In the area near the Fraser River flood plain, January winds are most frequently from the east or northeast, bringing cold, dry air from the interior of British Columbia. These winds converge and head northwest in the central and northern Salish Sea.
Winters are generally mild in the Salish Sea Bioregion in part because the mountain ranges to the east block cold air from the interior. However, easterly winds can bring cold interior air to the coast via some large, low-lying valleys. Wind direction in January is a major control of daily weather conditions, with heavy precipitation most frequently associated with westerly or southwesterly winds and extreme cold spells most frequently associated with easterly or northeasterly winds.
The maps above show the prevailing, or most frequent, wind direction for specific months. However, both the speed and direction of wind can vary considerably over the year. Wind rose diagrams can be used to visualize the frequency of specific wind directions and speeds over the year.
The map and wind rose diagrams below show the frequency of occurrence of specific wind directions and speeds over the entire year based on station records from 1991-2020. Zoom, pan, and click on the station icons to access wind rose diagrams for each station.
Bellingham
Bellingham. Click to expand.
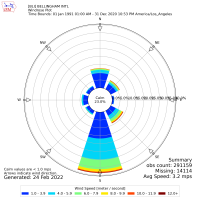
1991-2020 annual wind statistics for Bellingham International Airport, WA. Created using Iowa State University's Environmental Mesonet website.
Saturna Island
Saturna Island. Click to expand.
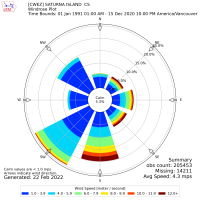
1991-2020 annual wind statistics for Saturna Island, BC. Created using Iowa State University's Environmental Mesonet website.
Squamish
Squamish. Click to expand.
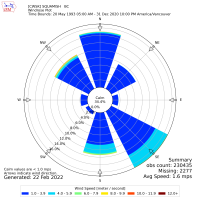
1991-2020 annual wind statistics for Squamish, BC. Created using Iowa State University's Environmental Mesonet website.
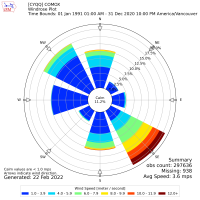
Comox
Comox. Click to expand.
1991-2020 annual wind statistics for Comox, BC. Created using Iowa State University's Environmental Mesonet website.
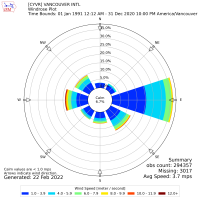
Vancouver
Vancouver. Click to expand.
1991-2020 annual wind statistics for Vancouver, BC. Created using Iowa State University's Environmental Mesonet website.
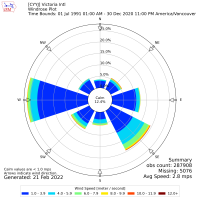
Victoria
Victoria. Click to expand.
1991-2020 annual wind statistics for Victoria, BC. Created using Iowa State University's Environmental Mesonet website.
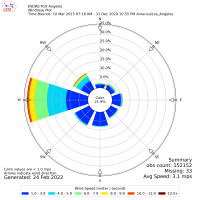
Port Angeles
Port Angeles. Click to expand.
1991-2020 annual wind statistics for Port Angeles, WA. Created using Iowa State University's Environmental Mesonet website.
Whidbey Island
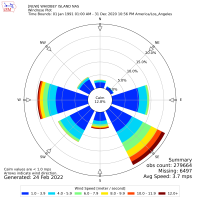
Whidbey Island. Click to expand.
1991-2020 annual wind statistics for Whidbey Island Naval Air Station, WA. Created using Iowa State University's Environmental Mesonet website.
Olympia
Olympia. Click to expand.
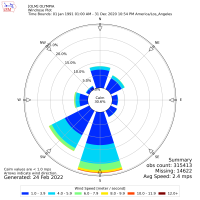
1991-2020 annual wind statistics for Olympia, WA. Created using Iowa State University's Environmental Mesonet website.
Seattle-Tacoma Airport
Seattle-Tacoma Airport. Click to expand.
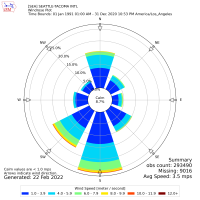
1991-2020 annual wind statistics for the Seattle-Tacoma International Aiport, WA. Created using Iowa State University's Environmental Mesonet website.
Bellingham
1991-2020 annual wind statistics for Bellingham International Airport, WA. Created using Iowa State University's Environmental Mesonet website .
Saturna Island
1991-2020 annual wind statistics for Saturna Island, BC. Created using Iowa State University's Environmental Mesonet website .
Squamish
1991-2020 annual wind statistics for Squamish, BC. Created using Iowa State University's Environmental Mesonet website .
Comox
1991-2020 annual wind statistics for Comox, BC. Created using Iowa State University's Environmental Mesonet website .
Vancouver
1991-2020 annual wind statistics for Vancouver, BC. Created using Iowa State University's Environmental Mesonet website .
Victoria
1991-2020 annual wind statistics for Victoria, BC. Created using Iowa State University's Environmental Mesonet website .
Port Angeles
1991-2020 annual wind statistics for Port Angeles, WA. Created using Iowa State University's Environmental Mesonet website .
Whidbey Island
1991-2020 annual wind statistics for Whidbey Island Naval Air Station, WA. Created using Iowa State University's Environmental Mesonet website .
Olympia
1991-2020 annual wind statistics for Olympia, WA. Created using Iowa State University's Environmental Mesonet website .
Seattle-Tacoma Airport
1991-2020 annual wind statistics for the Seattle-Tacoma International Aiport, WA. Created using Iowa State University's Environmental Mesonet website .
Precipitation
This map shows 1991-2020 average total annual precipitation as continuous contours along with monthly records for individual climate stations marked with a + sign. Zoom and pan to explore precipitation patterns across this map. Click on the map to see the total annual precipitation ranges represented by each colored contour. Click on the + signs to access monthly precipitation records for individual climate stations.
Total annual precipitation varies considerably across the Salish Sea Bioregion in response to differences in topographic setting and prevailing wind direction. As wind encounters a topographic barrier and is forced to rise, it cools as it moves up in the atmosphere. If the air cools enough, condensation occurs, creating clouds and precipitation. Precipitation therefore generally increases with elevation and is higher on the windward side of mountains. As wind moves down the leeward side of a topographic barriers, it is heated through compression. This often creates a rain shadow effect, where precipitation is dramatically reduced on the leeward side of mountains. Particularly striking examples of rain shadows are found on the northeastern corner of the Olympic Peninsula and in the San Juan - Gulf Islands Archipelago.
Seasonal patterns of precipitation are pronounced in this region due to large-scale fluctuations in atmospheric circulation and pressure patterns. On average across the region, 80% of total annual precipitation arrives between October and April. Summers are typically characterized by high atmospheric pressure, descending air, and thus very low levels of precipitation. During late autumn and into early spring, the midlatitude jet stream steers storms onshore, bringing humid, cool air and heavy precipitation.
Temperature
Maximum Temperature
These maps show 1991-2020 seasonal maximum temperature averages as continuous contours along with monthly records for individual climate stations marked with a + sign. Zoom and pan to explore temperature patterns across this map. Click on the map to see the seasonal maximum temperature ranges represented by each colored contour. Click on the + signs to access monthly maximum temperature records for individual climate stations. Use the buttons below to switch between the summer and winter maps.
Temperature values in Celsius (C) and Fahrenheit (F)
Maximum temperatures are generally reached in mid-afternoon due to a combination of more intense solar radiation and more long-wave radiation emitted from the Earth's surface. Seasonally, December and January are our coldest months, while July and August are our warmest.
The strongest spatial pattern on these maps of maximum temperature is the strong relationship between elevation and temperature. Higher elevation mountainous areas have considerably colder maximum temperatures throughout the year. Proximity to the sea and prevailing local wind direction create additional local variability. Low elevation inland areas removed from the moderating effects of the ocean have notably higher summer maximum temperatures. Areas with frequent onshore winds bringing cool marine air, such as the coastline along the Strait of Juan de Fuca and the San Juan-Gulf Islands Archipelago, have lower summer maximum temperatures. During the winter, areas with frequent easterly winds bringing cold, continental air have lower maximum temperatures.
Minimum Temperature
These maps show 1991-2020 seasonal minimum temperature averages as continuous contours along with monthly records for individual climate stations marked with a + sign. Zoom and pan to explore temperature patterns across this map. Click on the map to see the seasonal minimum temperature ranges represented by each colored contour. Click on the + signs to access monthly minimum temperature records for individual climate stations. Use the buttons below to switch between the summer and winter maps.
Temperature values in Celsius (C) and Fahrenheit (F)
Minimum temperatures are generally reached just before sunrise, following a night of heat being lost through the radiation of long-wave energy from the Earth's surface without any shortwave radiation arriving from the sun to offset this loss. Seasonally, January and February typically experience the lowest minimum temperatures, while July and August experience the highest minimum temperatures.
Local topography and prevailing wind directions strongly influence the spatial patterns of variability in minimum temperature visible on these maps. Higher elevations have lower minimum temperatures throughout the year. Minimum temperatures are typically higher in low-lying coastal areas. Prevailing wind direction also influences minimum temperatures. Areas that frequently experience strong onshore winds, such as the coastline along the Strait of Juan de Fuca and the San Juan-Gulf Islands Archipelago, experience lower summer minimum temperatures and higher winter minimum temperatures than other locations at the same elevation.
Temperature range
These maps show 1991-2020 average annual temperature ranges (the difference between the mean temperature of the warmest month and that of the coldest month) as continuous contours along with monthly records of mean temperature for individual climate stations marked with a + sign. Zoom and pan to explore temperature patterns across this map. Click on the map to see the annual temperature ranges represented by each colored contour. Click on the + signs to access monthly mean temperature records for individual climate stations.
Temperature seasonality, or the range of temperatures experienced over the year, is an important control on the species and ecosystems found in a region. The spatial patterns of seasonality shown on this map demonstrate the strong moderating influence of marine air. Coastal areas, and particularly those that frequently receive strong onshore wind flow, have lower annual temperature ranges. The Pacific Ocean and the Salish Sea release heat and warm the air above them during the winter, but tend to absorb heat and cool the air above them in the summer. Thus, we see cooler summers, warmer winters, and lower annual temperature ranges in areas influenced primarily by marine air masses. Inland areas have higher annual temperature ranges because they receive very cold, dry air in the winter and hot, dry air in the summer from the interior of western North America .
Data and Sources
Visit the Salish Sea Atlas website to access all of the atlas's data, chapters, and reference maps.
View data sources and processing details, or download the datasets used in this chapter of the Salish Sea Atlas :
- Salish Sea Bioregion Boundary
- Salish Sea Bioregion January Prevailing Wind Direction, 1991-2020
- Salish Sea Bioregion July Prevailing Wind Direction, 1991-2020
- Salish Sea Bioregion Climate Station Records, 1991-2020
- Salish Sea Bioregion Total Annual Precipitation, 1991-2020
- Salish Sea Bioregion Summer Maximum Temperature, 1991-2020
- Salish Sea Bioregion Winter Maximum Temperature, 1991-2020
- Salish Sea Bioregion Summer Minimum Temperature, 1991-2020
- Salish Sea Bioregion Winter Minimum Temperature, 1991-2020
- Salish Sea Bioregion Annual Temperature Range, 1991-2020
