Flood mapping and impact assessment in North Khartoum Sudan
ahmed.shihab7694@gmail.com
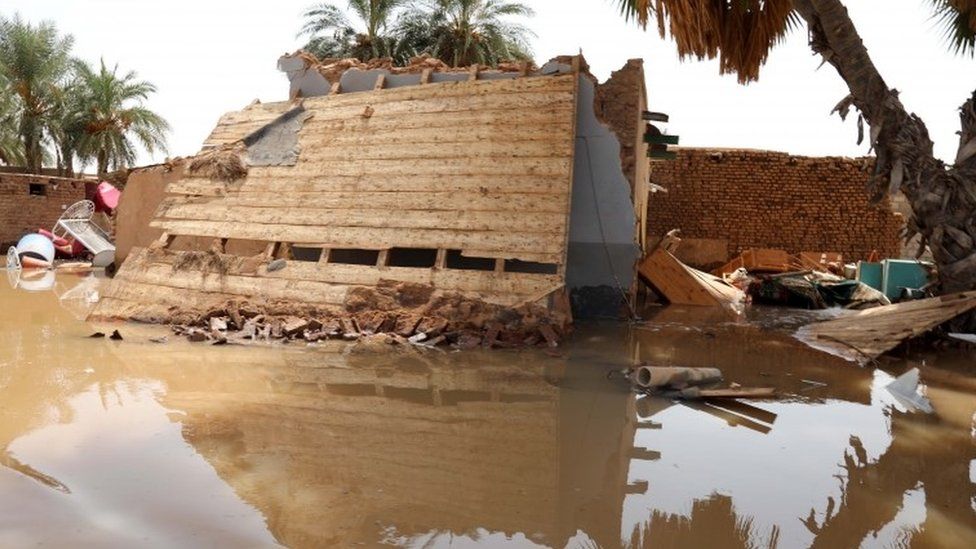
Sudan Nile Floods
Aljazeera Documentary
Floods are considered to be one of the greatest natural disasters that takes human lives all around the world, causes people to refuge from their homes and settlements and also cause huge damages to the infrastructure which requires a large cost to rebuild and rehabilitate
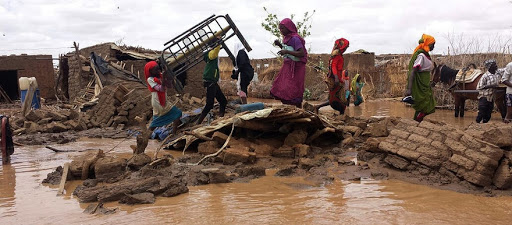
Floods in Sudan
Floods are the most frequent type of disaster worldwide. It can strike anywhere and anytime. Although floods can be predicted, they often cause massive damage and destruction of property as most urban communities are located near water sources such as coasts and rivers.
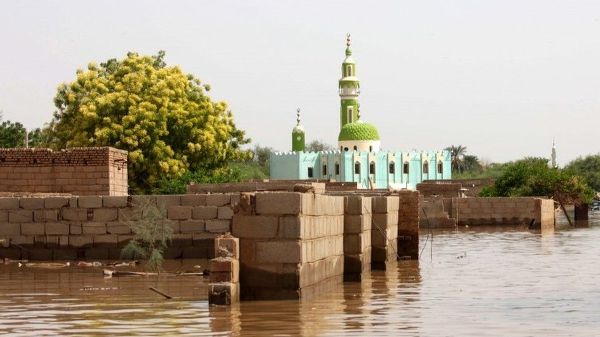
Floods in Sudan
Floods are one of the most common hazards in the Sudan. Flood effects can be local, impacting a neighborhood or community, or very large, affecting entire river basins and multiple states.
However, not all floods are alike. While some floods develop slowly, sometimes over a period of days, flash floods develop quickly, sometimes in just a few minutes and without any visible signs of rain.
in Sudan people are highly affected by flooding season in many areas such as sharg-alneel, north khartoum, sennar , kasalla and many others causing loss of lives and properties all over the world gis and remote sensing showed their capabilities in natural disaster management and damage assessment , this story will show flood mapping of floods occurred in north khartoum on the years 2018 and 2019 note that both floods are mapped from crisis image during the flooding seasons of both years.
this is the analysis extent of my project of flood mapping and impact assessment in north khartoum area. area located North of Khartoum city the Capital of Sudan
analysis extent
Here is a link to Download the Supervised land-cover classification processed in ArcMap and converted to kml format to open on Google Earth.
links to download kml files and open it in Google Earth.
Map illustrating the Flood mapping occurred on September of 2018, flood map acquired from sentinel-1 GRD imagery by Processing pre-flood and crisis images using Snap Software
2018 Flood
Roads Affected by the Flood on September of 2018
Affected Roads in 2018 Flood
Map illustrating type of land cover affected by the flood on September of 2018.
Flooded land-cover 2018
Graph of Land-cover Flooded on September of 2018
Map illustrating the Flood mapping occurred on August of 2019, flood map acquired from sentinel-1 GRD imagery by Processing pre-flood and crisis images using Snap Software
2019 Flood
Roads Affected by the Flood on August of 2019
Affected Roads in 2019
Map illustrating type of land cover affected by the flood on August of 2019.
Flooded land-cover 2019
Graph of Land-cover Flooded on August of 2019
Flood occurred on August of 2019 appear to be in a much larger magnitude than the Flood occurred on September of 2018 as Shown in the Sliding Flood maps bellow.
Sliding Maps to Compare Between the two years Floods
Map illustrating Areas of High Flood susceptibility across the past four years these areas are shown to be Flooded in each Rainy season therefore they are considered to be High Risk Areas, Buffer Zones were established to Classify the Risk of Flood Based on the Distance and Proximity from the Nile River.
Buffer zones classified into three zones: High Risk Zone is areas within 1500 meters, Medium Risk Zone is areas within 2000 meters and low Risk Zone is areas within 2500 meters from River Nile.
Buffer Zones


